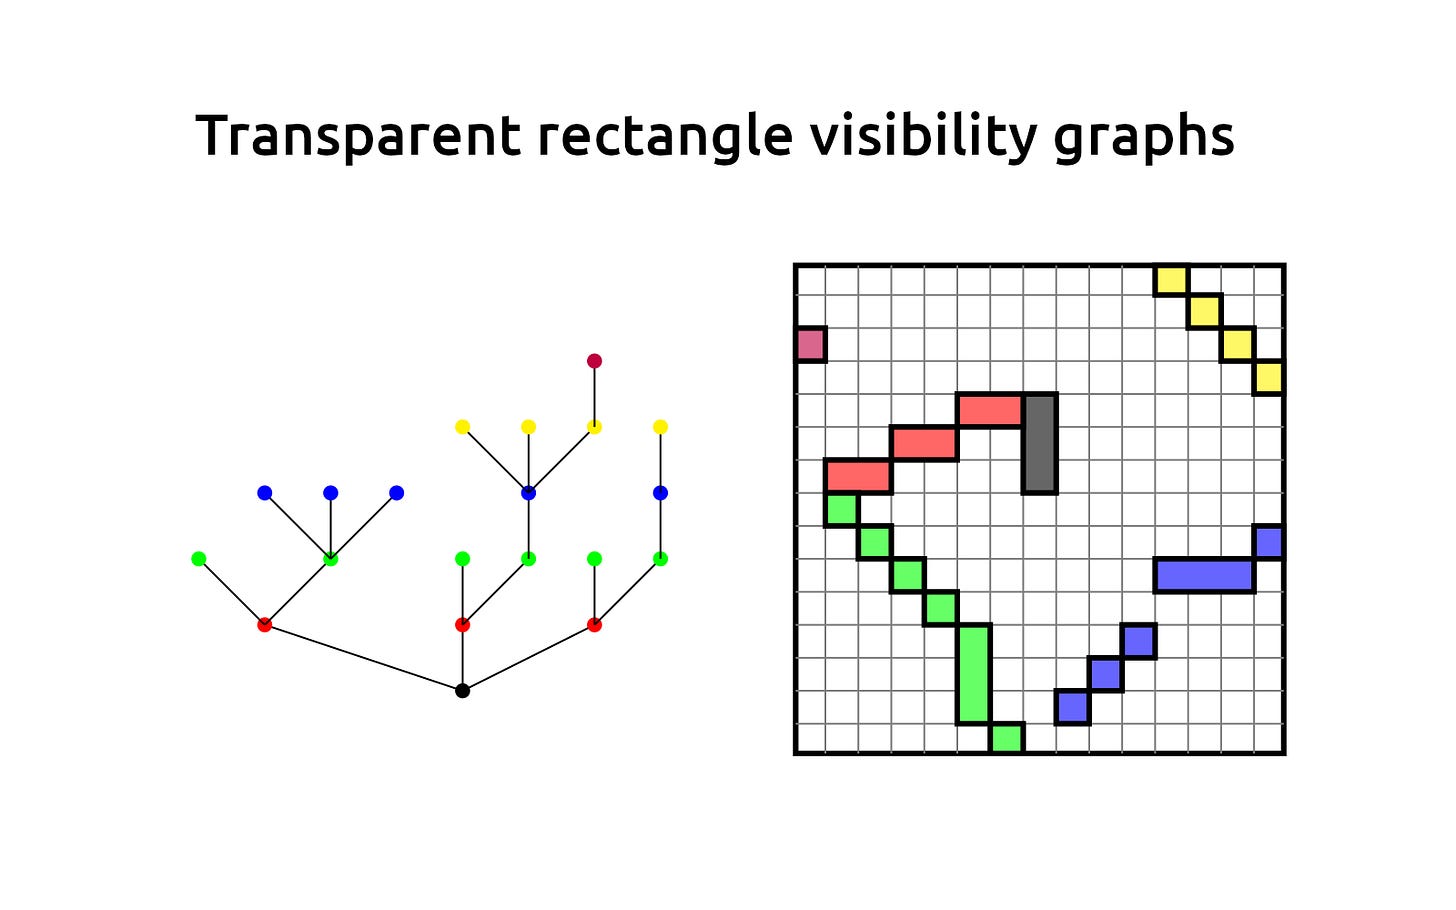
A graph consists of a set of vertices, some of which are joined in pairs by edges. It is possible to reconstruct the graph shown above and to the left from the arrangement of rectangles shown on the right. Each of the 20 rectangles corresponds to one of the 20 vertices in the graph, and there is an edge between two vertices if and only if there is a direct vertical or horizontal line of sight between two points inside the corresponding rectangles. A graph that can be constructed from rectangles in this way is called a rectangle visibility graph (RVG).
A transparent rectangle visibility graph (TRVG) is a variant of this definition. In this case, it is permissible for the vertical or horizontal lines of sight between points in different rectangles to pass through another rectangle; in other words, the rectangles are transparent. For example, consider the row of three red squares shown above, and number them “1, 2, 3” from left to right. If the squares are opaque, then there is a horizontal line of sight between squares 1 and 2, and between squares 2 and 3, but not between squares 1 and 3 because square 2 is in the way. This gives an RVG in which 2 is connected to 1 and to 3, but 1 is not connected to 3. On the other hand, if the squares are transparent then there is a horizontal line of sight between squares 1 and 3, passing through 2. This gives a TRVG in which 1, 2, and 3 are all connected to each other.
Rectangle visibility graphs were introduced in 1976 as a tool for designing printed circuit boards, and TRVGs were introduced in the recent paper Transparent Rectangle Visibility Graphs by Chaipattana Juntarapomdach and Teeradej Kittipassorn. An example of a TRVG given in the paper is the complete bipartite graph K3,4, as shown above. This graph has 3 green and 4 red vertices, with an edge connecting each green vertex to each red vertex, but no edges connecting two vertices of the same colour. The arrangement of rectangles on the right proves that K3,4 is indeed a TRVG (and also an RVG).
The paper gives some infinite families of TRVGs, like the star graphs K1,n shown above. More generally any tree is a TRVG. A tree is a graph in which any two vertices are connected by a unique path. The graph with 20 vertices and 19 edges shown in the top picture is a more complicated example of a tree.
The graph K4,4 turns out not to be a TRVG. This follows from the theorems in the paper, and is not an obvious result. However, it is possible to represent K4,4 as a TRVG on the surface of a torus, as shown above. Here, the bounding rectangle wraps around so that the left edge is identified with the right edge, and the top edge is identified with the bottom edge. The four small green squares in each corner are actually the four pieces of a larger green square on the torus.
The paper also shows that some infinite graphs are TRVGs, including the triangular grid graph shown above, as well as the square grid graph and the hexagonal grid graph. The corresponding arrangements of rectangles are somewhat complicated. Each vertex in the triangular grid graph is adjacent to six others, so each rectangle in the infinite arrangement below should have vertical or horizontal lines of sight to six other rectangles. This is indeed the case: for example, each of the squares in the arrangement below has a horizontal line of sight to the two squares touching it, a horizontal line of sight to two long rectangles to the right, and a vertical line of sight to two long rectangles below it. In this case, it is important for the rectangles to be transparent.
Picture credits and relevant links
The pictures of the complete bipartite graphs are edited versions of pictures by Koko90, and they appear on Wikimedia Commons.
All the other pictures come from the paper by Chaipattana Juntarapomdach and Teeradej Kittipassorn.
Wikipedia has a page on complete bipartite graphs.
Substack management by The Green Room.
I'd never heard of RVGs, let alone TRVGs. What a cool idea, thanks for sharing!
I was not aware of TRVGs but I was immediately reminded of [interval graphs](https://en.wikipedia.org/wiki/Interval_graph) and the related [interval trees](https://en.wikipedia.org/wiki/Interval_tree) of which TRVGs seem to be a generalisation of in two dimensions. Especially with this constraint on the rectangles to be aligned to the axes. Each rectangle then could represent two coupled intervals and the condition on the existence of the edge is translated to whether or not they overlap in a given dimension.