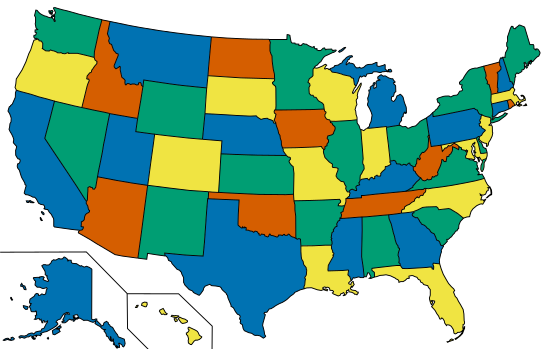
The Four Colour Theorem proves that no more than four colours are required to colour the regions of any map in such a way that no two adjacent regions have the same colour. The picture above shows a map of the United States that satisfies these conditions and only requires four colours (or “colors” in this case).
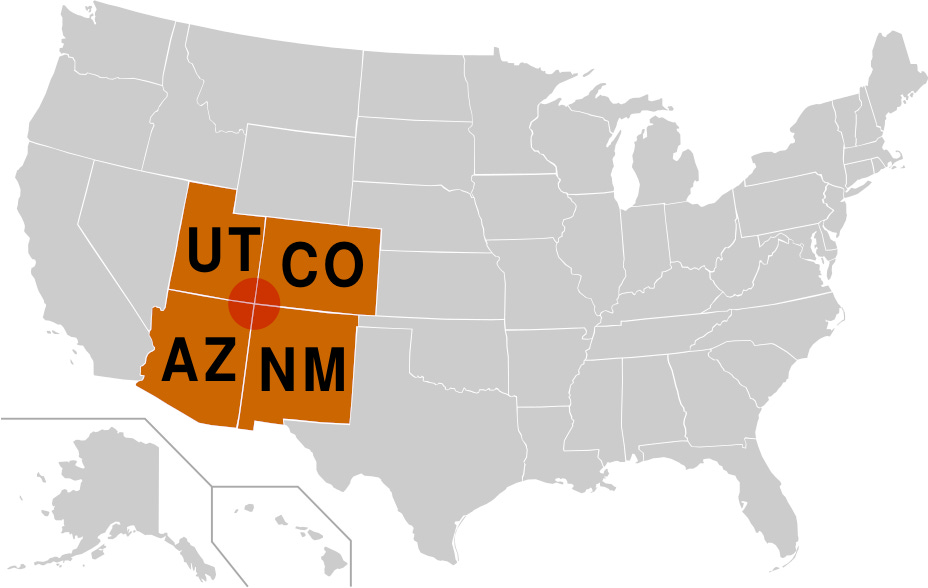
The Four Colour Theorem allows regions to have the same colour if they merely touch at a point. The only location in the United States where four states meet at a point is known as Four Corners, which is the common point of intersection of Utah, Colorado, New Mexico, and Arizona. Although these states all have different colours on the map, this is not a requirement of the theorem. So how many colours are required to colour the regions of a map if regions are required to have different colours even if they only meet at a point?
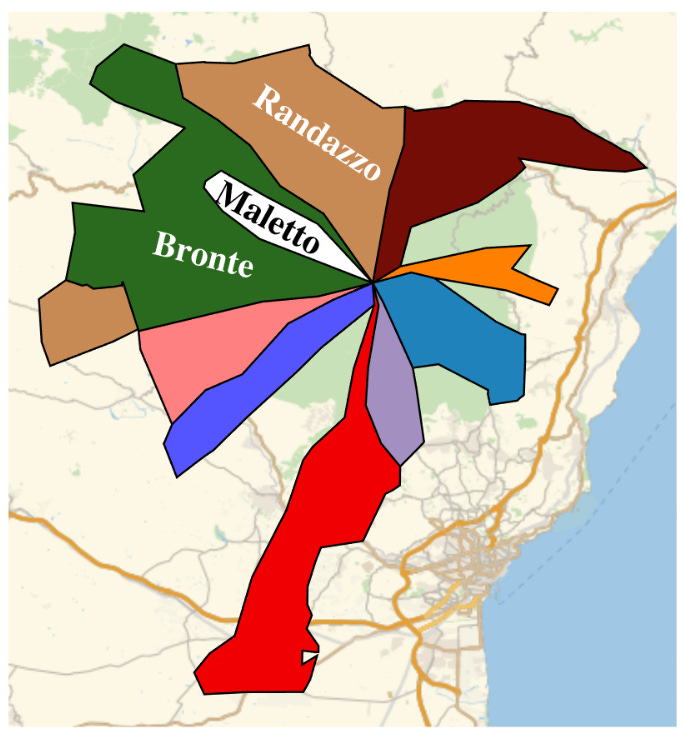
The picture above shows an area of Sicily in which ten different townships meet at a point, namely the summit of Mount Etna. The township of Randazzo is disconnected, and one of the townships (Maletto) is completely surrounded by one of the others (Bronte). This gives rise to an elevenfold point of intersection involving ten geographical regions. If regions meeting at a point are required to have different colours, it follows that at least ten colours are needed to colour the map above. It is easy to imagine examples like this that require even more colours, which implies that in general, there is no limit to the number of colours that might be required.
It is possible to give bounds for the number of colours required as a function of q, the maximum number of regions that touch at a point. In the maps shown above, the number q is 4. These maps should be thought of as distorted maps of the surface of a sphere, similar to maps of the world. More specifically, it is understood that (1) the left edge and right edge of the map wrap around and fit together; (2) the top edge is pinched together to form a north pole; and (3) the bottom edge is pinched together to form a south pole. The picture on the right shows the same map as the picture on the left, but distorted so that the yellow area includes both the north and the south poles.
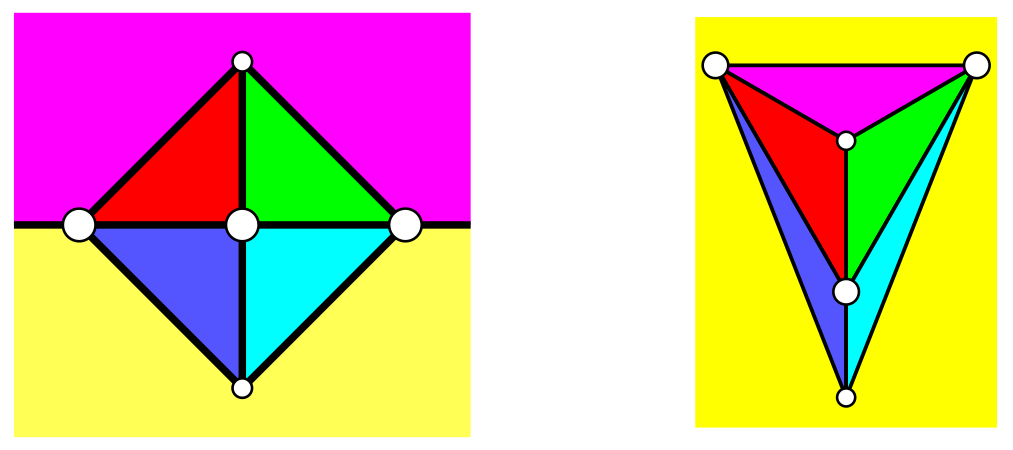
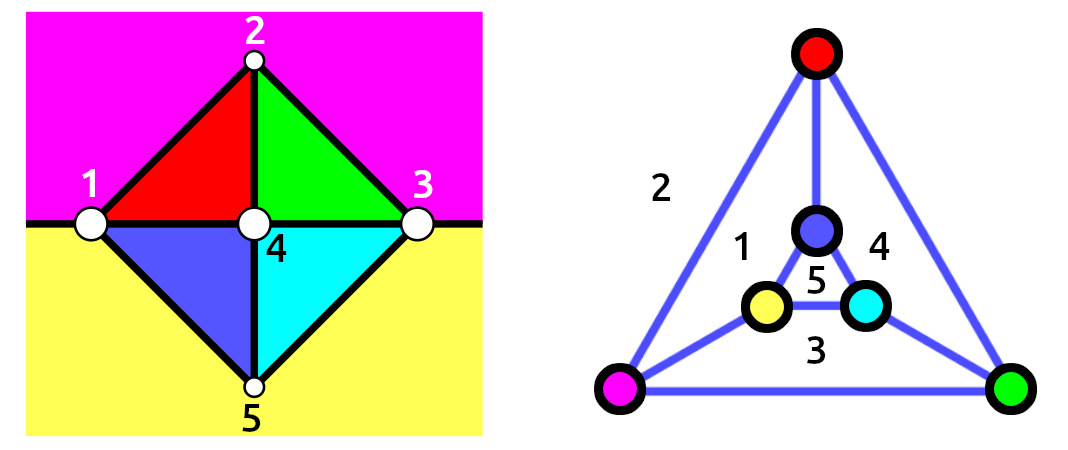
One way to understand what is going on is to understand a map in terms of its dual map. The map below and to the left has coloured regions (also known as “faces”) and numbered vertices. The map below and to the right is the dual map, in which these roles are reversed: there are numbered regions and coloured vertices, and the number q is the largest possible number of vertices on a face. A map and its dual have the same number of edges. The edge connecting vertices 1 and 3 in the map on the left separates the magenta and yellow faces, and this corresponds to the edge in the dual map that connects the magenta and yellow vertices, and separates the faces numbered 1 and 3.
If we require regions of a map to have different colours if they share a common point, this is equivalent to requiring vertices that lie on the same face of the dual map to have different colours. A graph like the one above and to the right, in which any two vertices lie on a common face, is called facially complete. For example, the green and blue vertices both lie on face 4, whereas the red and magenta vertices both lie on face 1 (and also on the outer face, face 2). Because the dual map (on the right) is facially complete, it follows that all the regions of the original map (on the left) have distinct colours, because any two regions meet at a point.
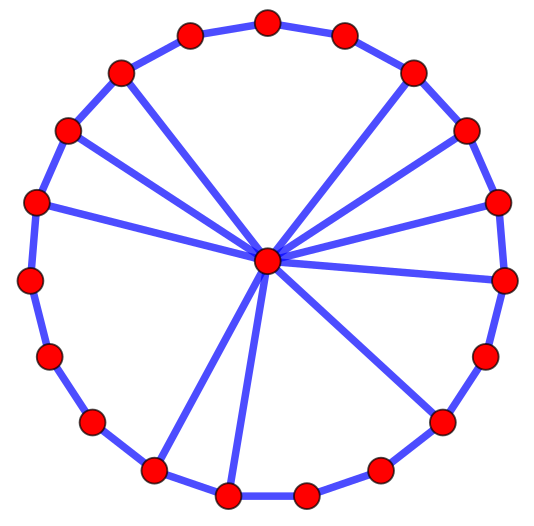
The recent paper A Catalog of Facially Complete Graphs by James Tilley, Stan Wagon, and Eric Weisstein classifies all the possible facially complete graphs into seven infinite families. The picture above shows a typical example of a facially complete graph of type 4. The authors call this an n-wheel, because it has the form of a wheel with missing spokes. It is possible to tell just by looking at the graph that it is facially complete, because any two of its vertices lie on a common face.
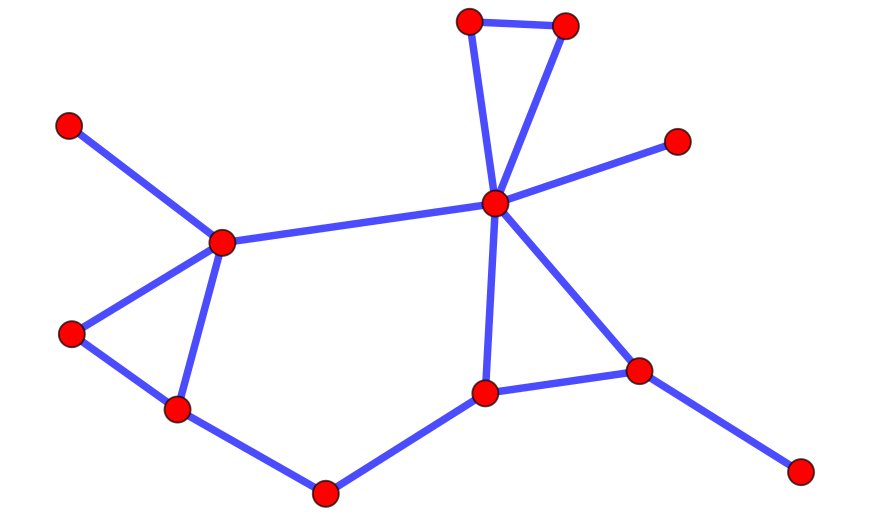
The facially complete graphs of type 7 are the outerplanar graphs, which include the constellation-like graph shown above. This graph is facially complete because any pair of vertices lies on the outer face. Another way to say this is that if we were to flood the outside of the graph, all the vertices would get wet. The authors use their results to provide an easier proof of the theorem that a facially complete planar graph has at most 3q/2 vertices, where q is the maximum number of vertices on a face.
Picture credits and relevant links
The US map is by Derfel73, Dbenbenn, Strangerpete, and inductiveload. It appears on the Wikipedia entry for the four colour theorem.
The four corners map is by Braindrain0000 and appears on Wikipedia.
The other pictures are edited versions of pictures in the paper by James Tilley, Stan Wagon, and Eric Weisstein.
Substack management by Buzz & Hum.


While not exactly related to the math content, I was interested in the Siciliy map, partly because I've always been fascinated by the four color theorem but also becasue I was recently there. Last summer, I visited Siciliy with friends, and made a point of climbing to the summit while I was there. As we sat at an outside bar in the evening with a view of the mountain, it erupted. It has been much more active this year, but I caught it just as it was starting to get more active. I'm sorry to say I hadn't appreciated the map implications at the time, but I do now. Thanks.
Not that it is not true that the number of colors is bounded. This is a big open question. The main conjecture is that if ≤q countries are allowed to share a point, then the number of colors needed is at most 3/2 q. This is true when q=3 by the Four Color Theorem. And Borodin proved it when q=4. But it is not proved when q=5. Oh: It has been proved also when q=6.